While doing a malware assessment I found myself consulting tutorials and documentation repeatedly about how SEH works. Therefore I wanted to have a simple demo for testing purposes with different tools.
Disclaimer: I haven’t been coding for a very long time. I do malware analysis & reverse engineering only part time, my experience is limited.
What does SEH code do?
Originally it’s meant to catch exceptions occurring at run-time. When analyzing malware a SEH is used as an anti-debug technique to slow down the analysis and just make it more time-consuming. It basically redirects the code flow to the exception handler by intentionally creating an exception, e.g. a division by zero.
Demo code in C/C++
I used the Microsoft C/C++ Optimizing Compiler Version 19.33.31630 with the following flags to compile:
cl.exe /MD /W4 /EHsc /GS- /guard:cf- /std:c++latest /O1 /Fe: release/sehexample.exe /Fd: release/ /Fo: release/ sehexample.cpp
Note that you can build a 32 bit version and a 64 bit version by either launching the “x86 Native Tools Command Prompt for VS 2022” or the “x64 Native Tools Command Prompt for VS 2022” in the Windows Start menu. While apparently most malware is still compiled in 32 bit but this may soon change. Also, IDA Free provides a free cloud decompiler service for 64 bit only. Ghidra does decompile 32 and 64 bit PE binaries.
#include <stdio.h>
#include <Windows.h>

int main()
{
    printf("Entered Main\r\n");
    __try
    {
        printf("> Trying ...\r\n");
        int* pint = NULL; // 1)
        *pint = 100; // 2)
        printf("> You shouldn't see this message\r\n");
    }
    __except(EXCEPTION_EXECUTE_HANDLER)
    {
        printf("Executing SEH __except block\r\n"); // 3)
        exit(0);
    }

    printf("Returned from SEH block.\r\n");

    return 0;
}
The example code initializes a null-pointer at 1) and then tries to write some data into this memory region at 2). Obviously, if you are familiar to “low-level” programming, this is a so-called null pointer dereference and the code tries to write into invalid or non-existing memory. In this case it’s the address 0x00000000.
Wouldn’t there be code to catch such a fatal exception the program would just crash and that’s it. Therefore you can add a __try / __except block to catch such errors. In this case the instruction at 2) fails and the code continues with 3). Then it would continue after the exception handling block normally if I hadn’t added a little exit(0) function call.
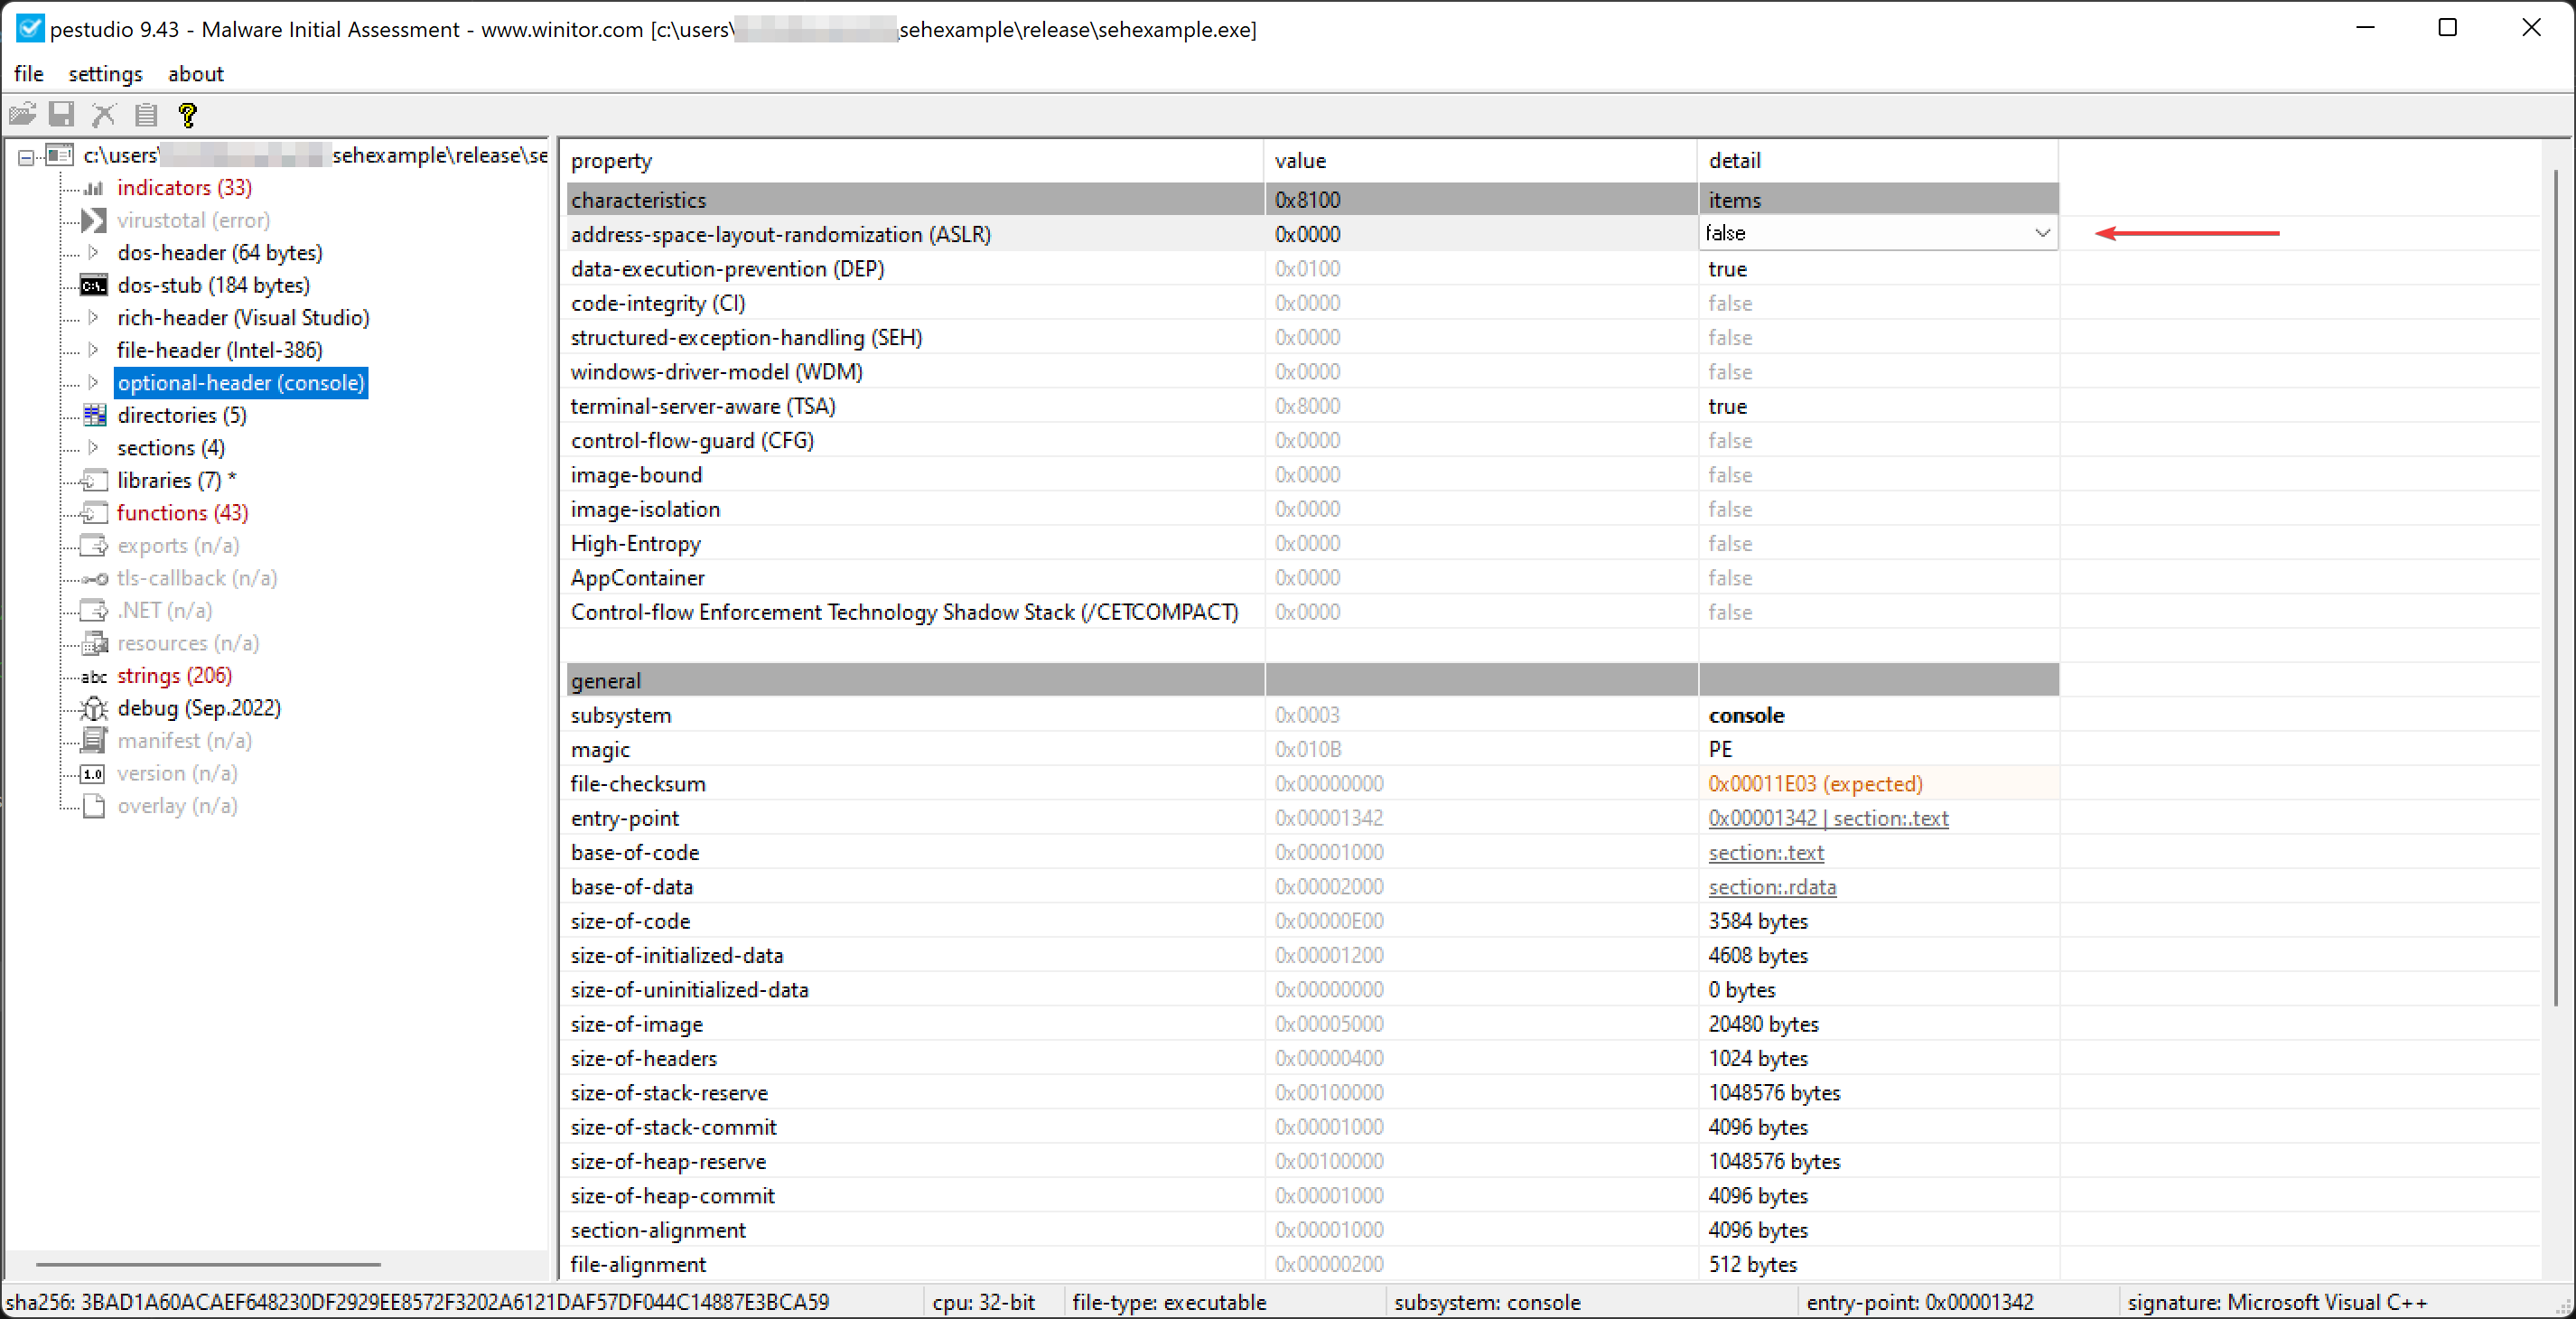
pestudio
For easier comparison of the offsets and addresses in different tools I disabled ASLR.
Running our sample
Of course a real malware sample doesn’t feature such verbose output but for understanding purposes I added them. Let’s execute the code in the cmd.exe, you could also use Powershell of course.
C:\Users\<...>\sehexample>Release\sehexample.exe
Entered Main
> Trying ...
Executing SEH __except block
The explanation I gave you further above is validated, I would say.
Note, however, that you don’t see the these two messages that you find in the source code. More on this later.
- “You shouldn’t see this message”
- “Returned from SEH block.”
How does SEH work? Theory
According to Practical Malware Analysis a SEH is a record that contains basically two entries.
struct _EXCEPTION_REGISTRATION
{
  DWORD previous_seh_record;
  DWORD handler_code;
}
Multiple SEHs are called a SEH chain and the top of this chain is reference by fs:[0]. The bare minimum code to add a exception handler looks like this.
push ExceptionHandler
push fs:[0]
mov fs:[0], esp
IDA Free
But this real world code looks a bit different.
In the menu I turned on Options -> General -> Disassembly -> Display disassembly line parts -> [x] Line prefixes (graph) to also see the offsets in the graph view for easier orientation. You should see something similar.
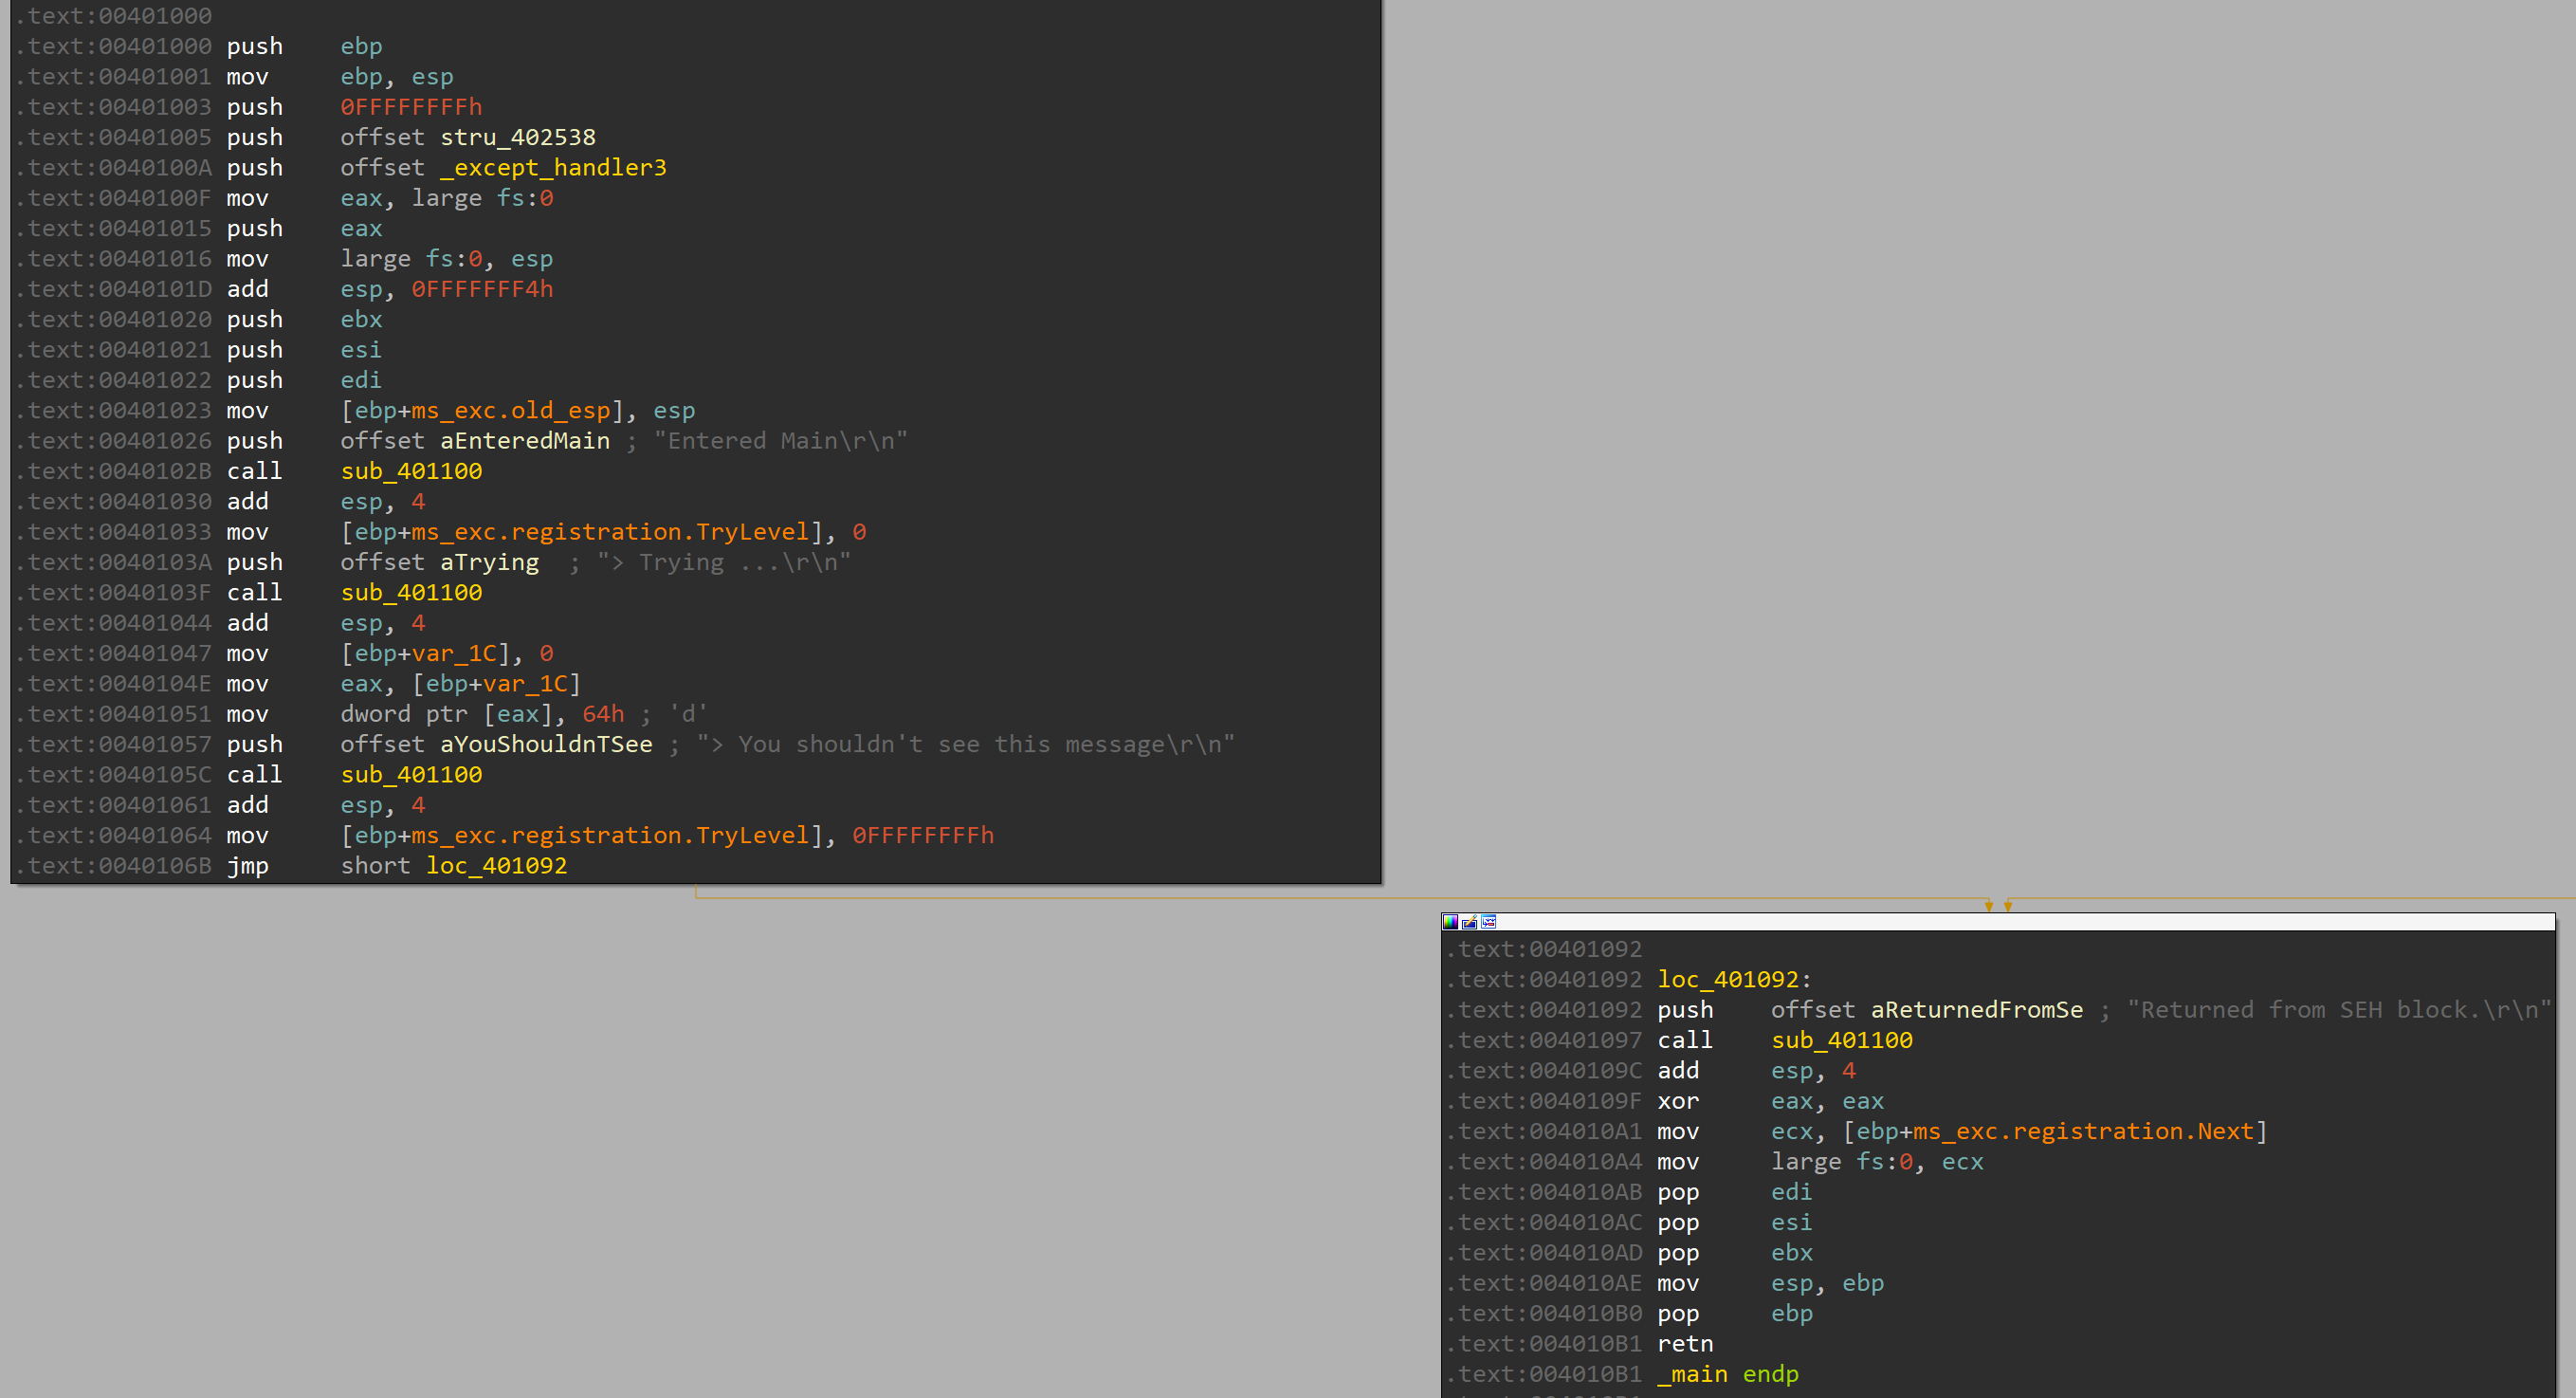
Note that IDA does not open the disassembly view at the PE’s entry-point 0x0000138E but at the start of the _main function at 0x00401000. The entry-point is called start in IDA and found at 00401138E. If you wonder where this difference of 0x00400000 comes from, this is called image rebasing and not covered here.
Just from looking at the flow you might conclude that the code flows directly to the end and you would expect that “Returned from SEH block.” is printed and then it exits. The same applies to malware where the author tries to trick you into believing it executes some meaningless code and terminates. The sole purpose of that is obfuscation and wasting the analysts time. And of course trying to send the analyst down the wrong rabbit hole.
IDA does a lot of analysis automatically. In a real world scenario with malware this might look totally different and confuse the engine so that you don’t get such a nice output. But for training purposes it’s probably better to start with something easier to understand.
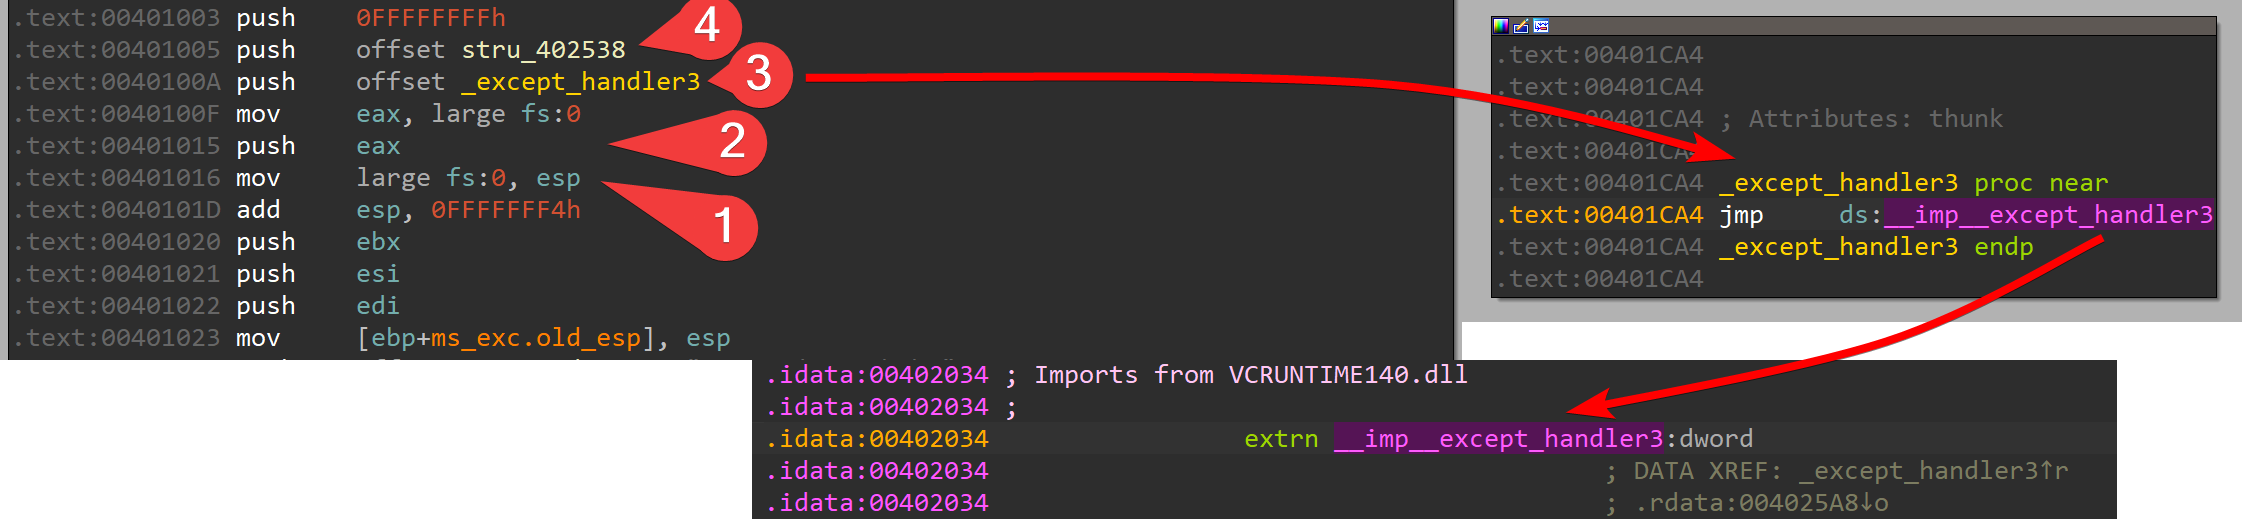
As we see in 1) it’s the exact same last step to update the top of the chain.
In 2) we see that the push fs:[0] happens in two steps via the eax register as intermediate.
At 3) we would expect the ExceptionHandler and when you follow the referenced address you see that it does ultimately end up in an external VCRUNTIME140.dll and not directly into my exception handling code.
Also at 4) you see that it also pushes some structure that isn’t neither the address of my SEH code.
From what I read this is due to SafeSEH. Let’s just keep that in mind that the real world code does a few more detours but the principle stays the same.
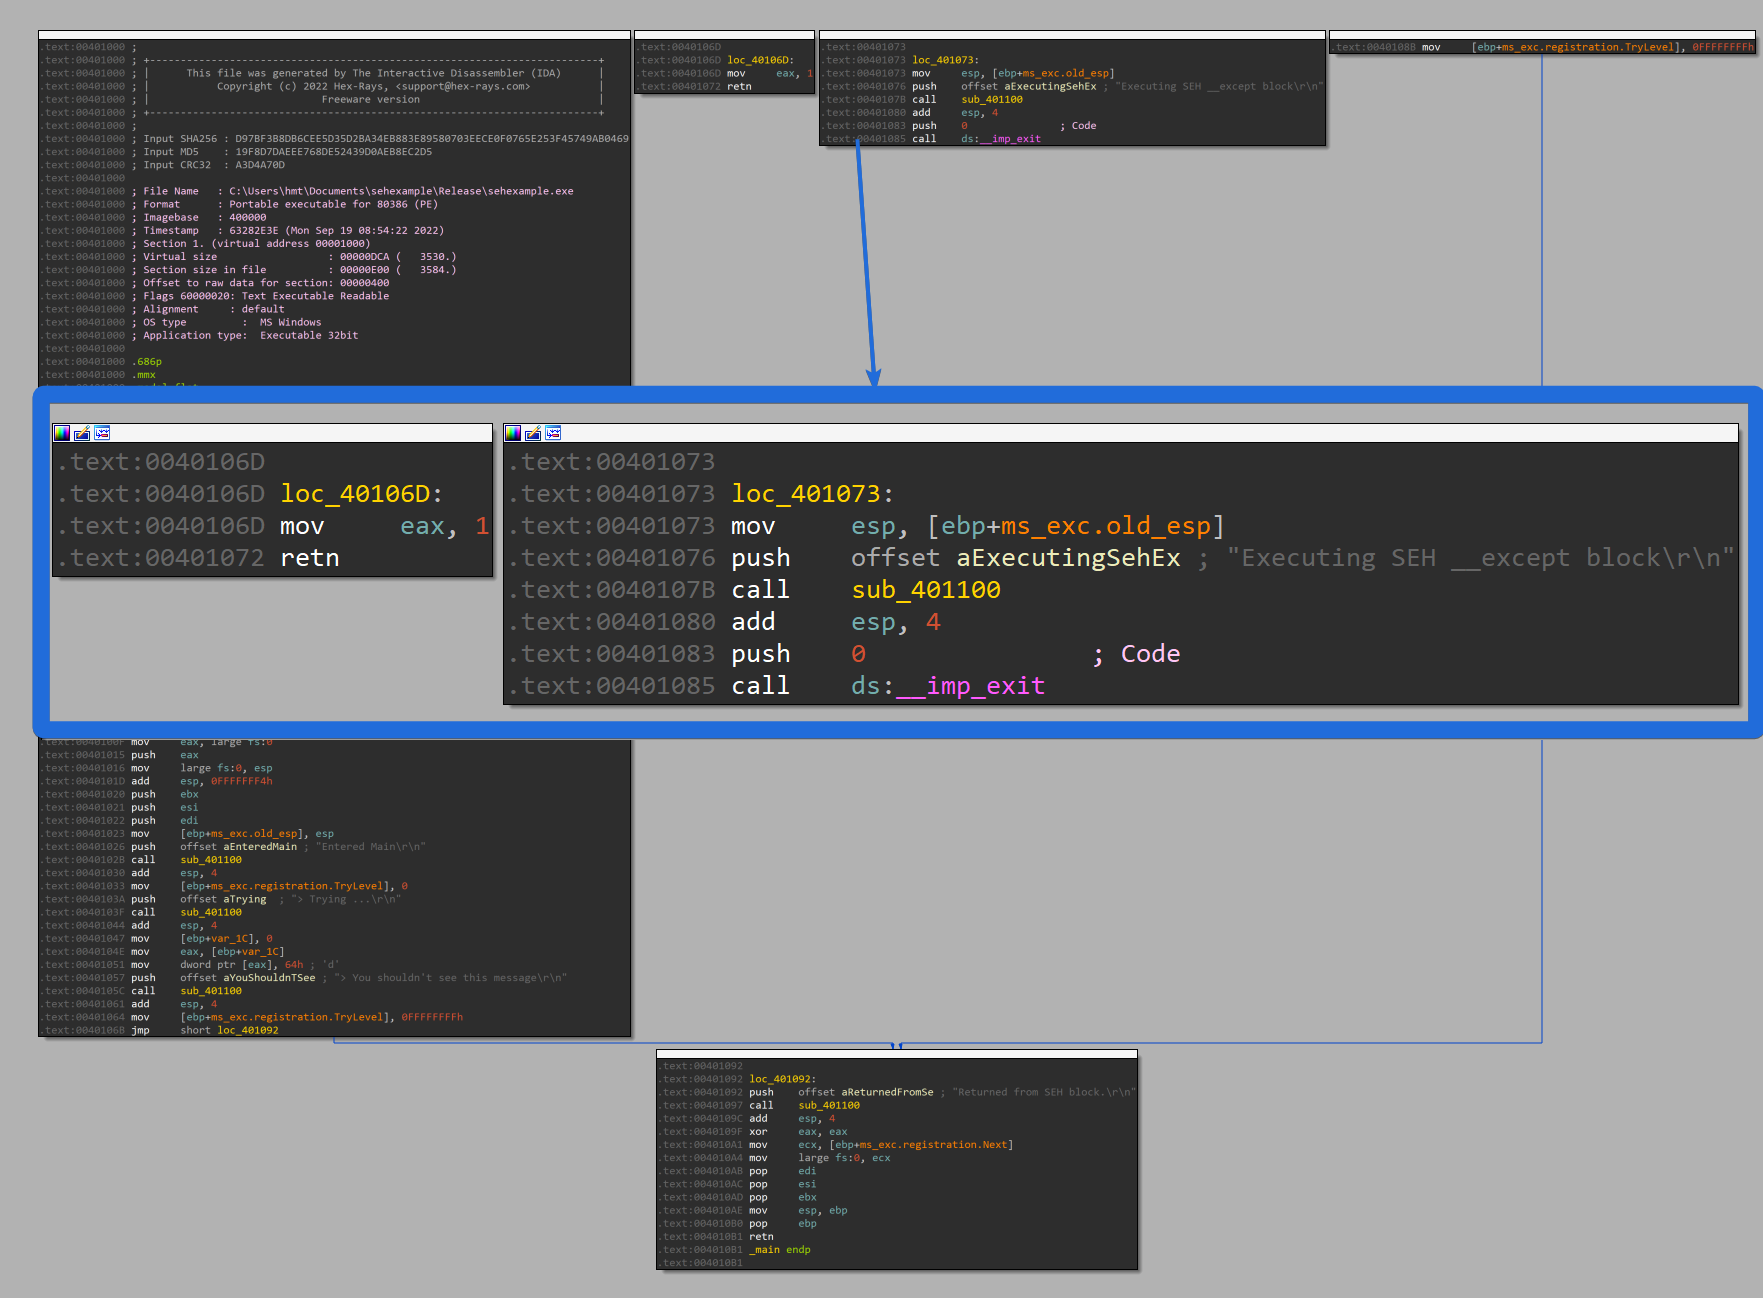
Let’s start with double-clicking on stru_402538 at offset 00401005 to open the structure of a so-called SEH3 _SCOPETABLE_ENTRY.

According to the presentation slides of Igor Skochinsky the structure looks like this. I added the values seen in the screenshot for better understanding.
struct _SCOPETABLE_ENTRY
{
  DWORD EnclosingLevel;  // 0FFFFFFFFh
  void* FilterFunc;      // offset loc_40106D
  void* HandlerFunc;     // offset loc_401073
}
The HandlerFunc is the pointer to our __except code body block which IDA conveniently does already show in the graph overview but I didn’t in the screenshot before.
So far we have seen that this works like that:
- Register the exception handler
- Run until the exception occurs
- Jump to where the HandlerFunc points to
Well, as we saw when running the sample it doesn’t resume after the exception code but simply exits. I added this exit(0) function call purely to approximate the behavior I have seen in malware and to actually add two ways this program can terminate. Also, I hopped to confuse the IDA engine into thinking the code continues normally after the exception block. Which it does. ;-)
x96dbg
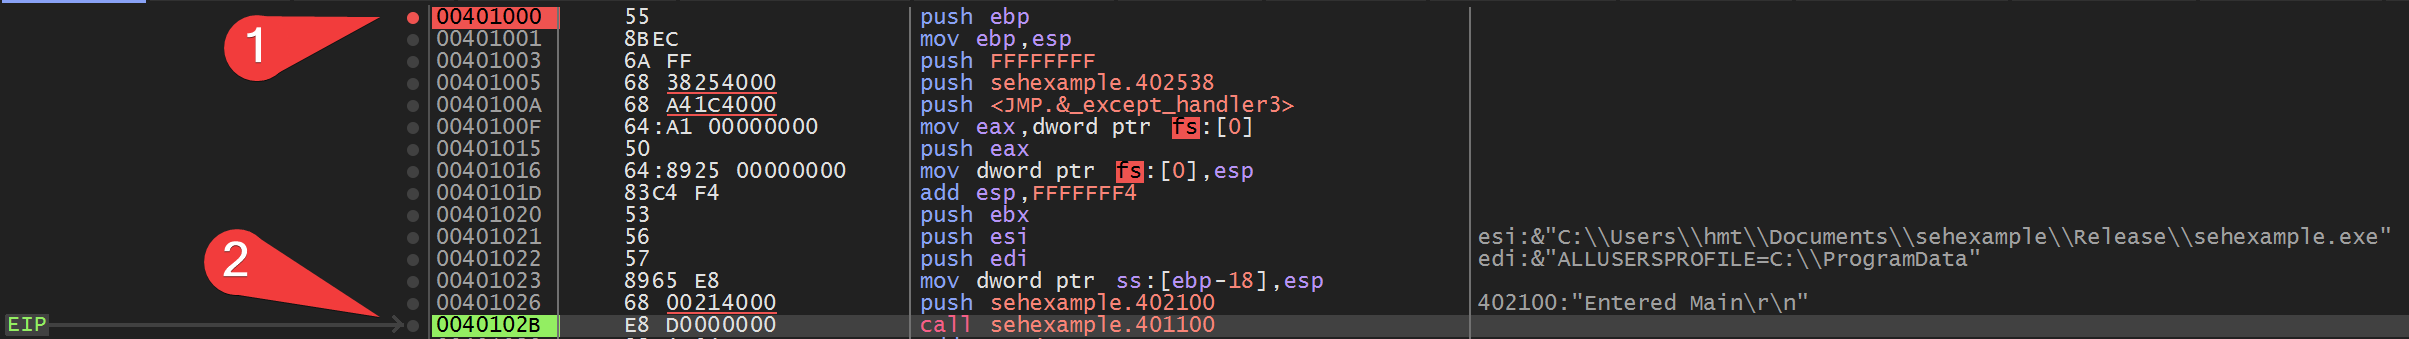
I opened the example, added a breakpoint with SetBPX 0401000 and ran it to this address 1). Should I have to restart the sample I can just hit F9 until it stops there. Then I ran the example until the SEH has been initialized and the first printf() would be called 2) by selecting the line and press F4 - run until selection.
When you look at the SEH tab you find the HandlerFunc. When you follow that entry by double clicking you see the already known jmp ds:__imp__except_handler3.
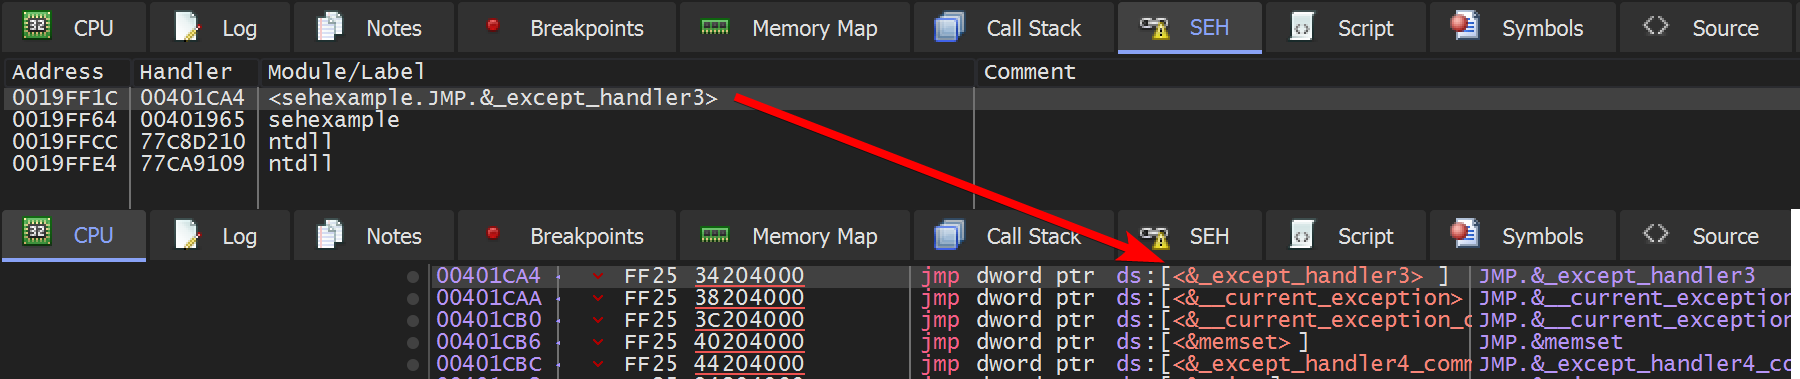
You don’t see where the actual code exception handling code resides, do you? Not quite.
Remember that the actual handler is __except_handler3 (I think the number 3 refers to SEH3), and just before a _SCOPETABLE_ENTRY is pushed? Let’s look at the actual SEH entry on the stack.
In the SEH tab you see the address 0019FF1C which is on the stack. In the stack window you see at 1) the pointer to the next SEH entry and below the address of the HandlerFunc and then the before mentioned stru_402538. We already saw that the HandlerFunc basically jumps into VCRUNTIME140.dll.
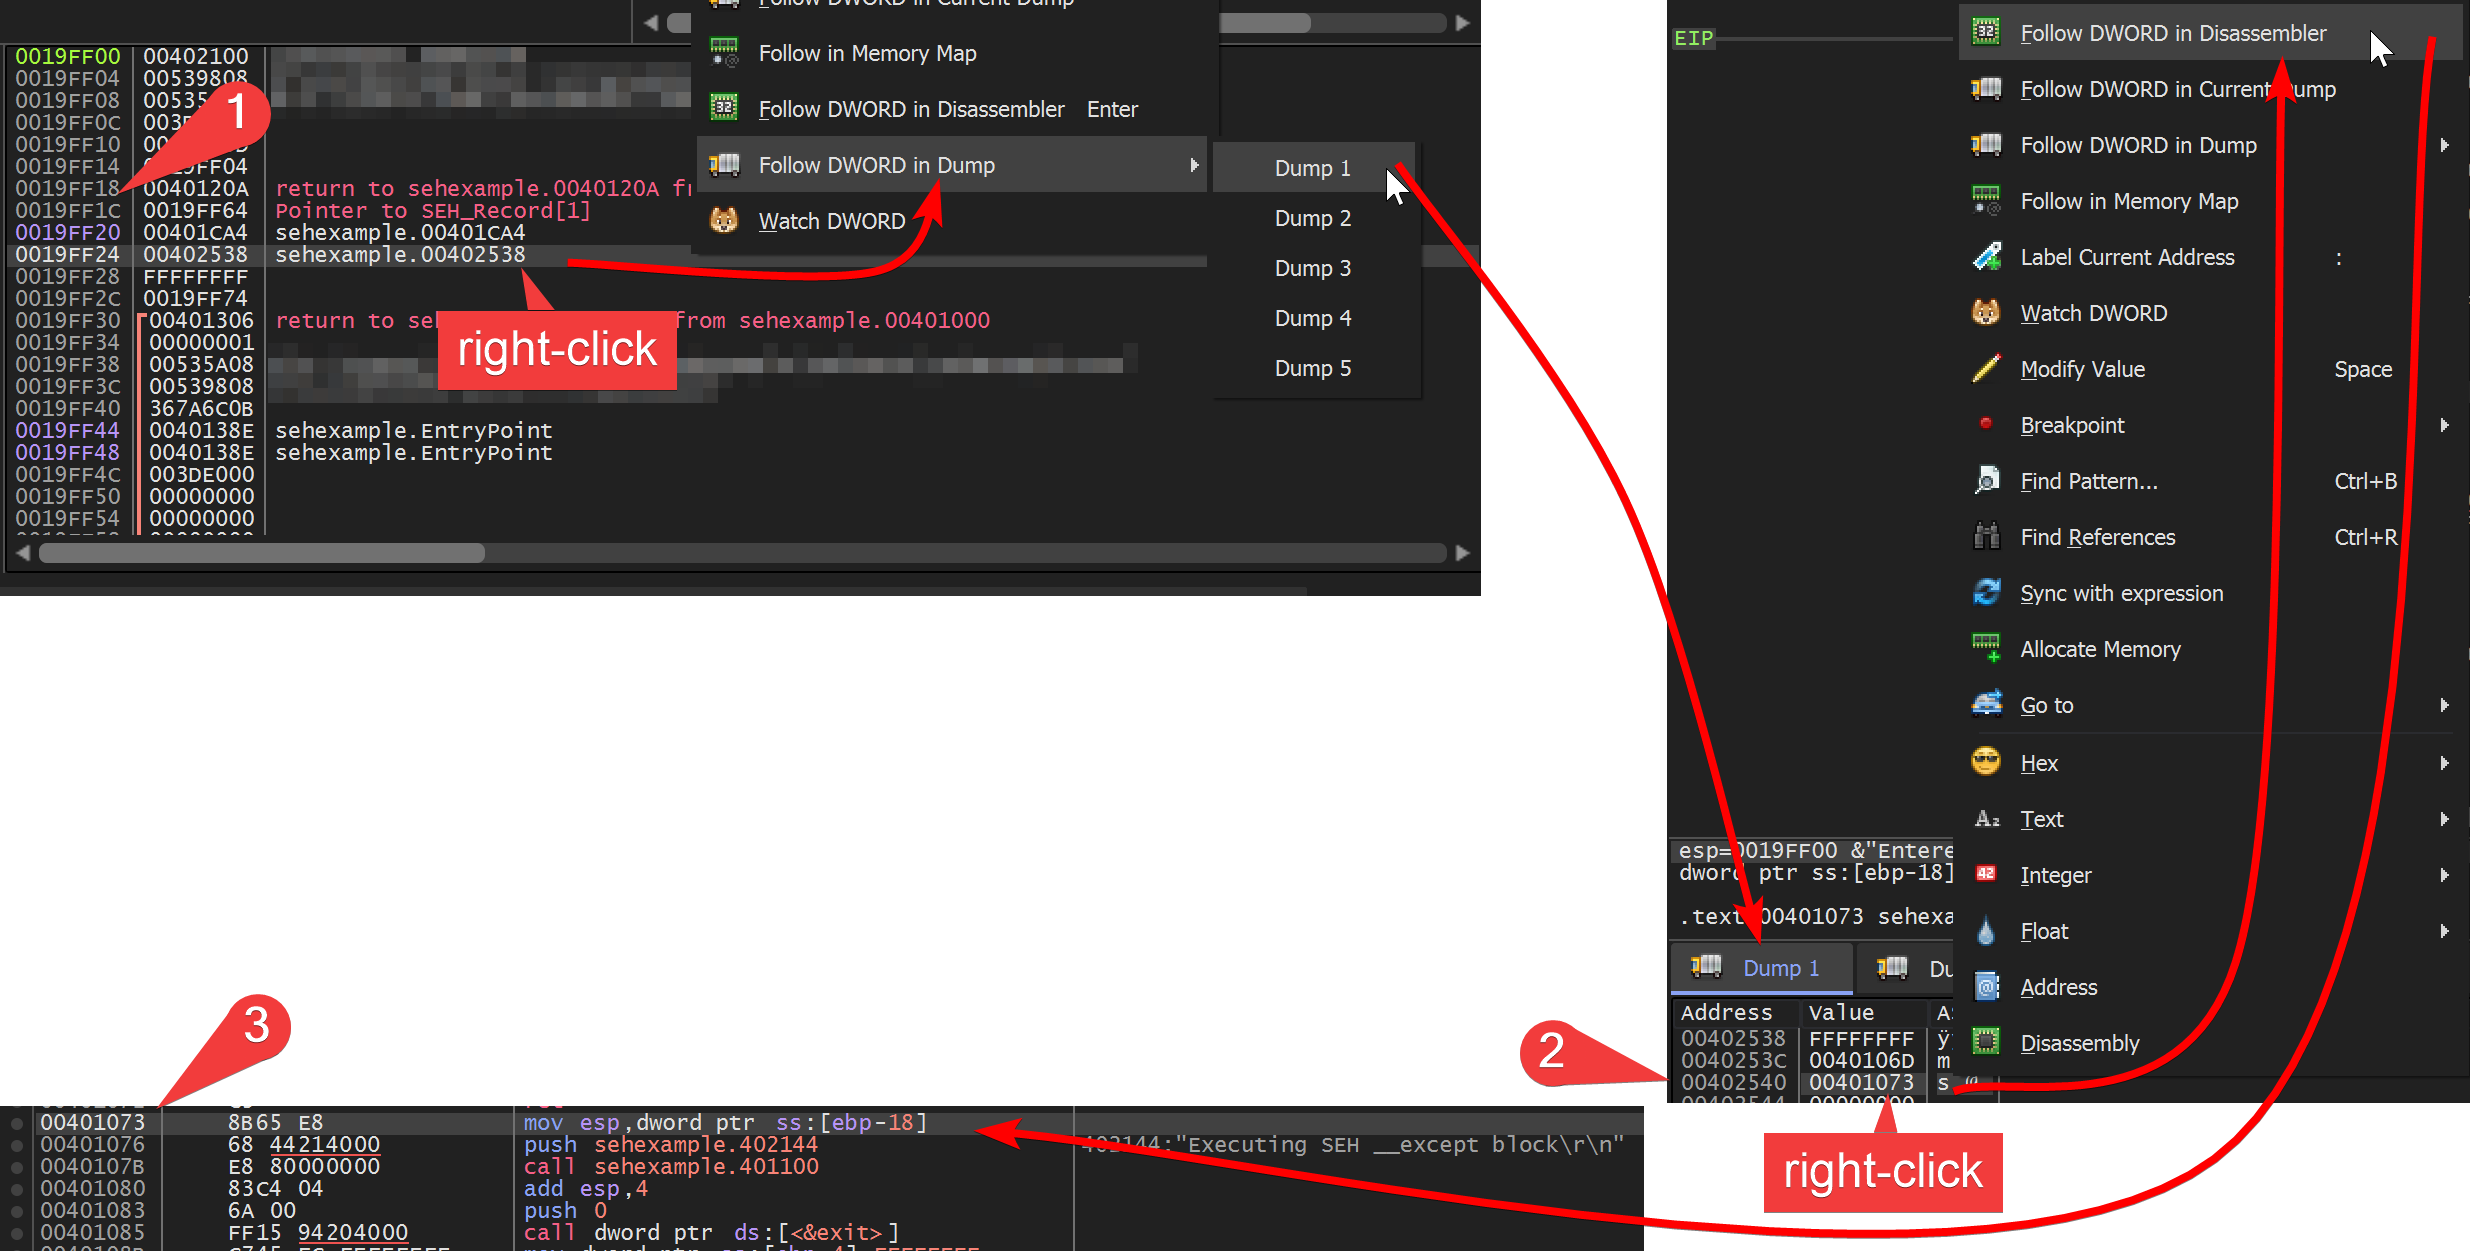
The next entry on the stack is the stru_402538, which you can follow in the memory by right-clicking the address -> Follow DWORD in Dump. There you can see at 2) that it contains the same address as we already saw in IDA. Remembering that in the _SCOPETABLE_ENTRY the actual HandlerFunc is at the last place, so we follow the address at offset 00402540 in the Disassembler window.
In the Disassembler window at 3) you can then recognize the same code we already saw in IDA.
Setting the breakpoint on a SEH handler function
I learned in the SANS FOR610 course the two following techniques. They won’t work in this case but I want to describe them anyway for the sake of completeness.
Breaking on the pushed handler function address
Set a breakpoint on the address that gets pushed before the fs:[0] gets pushed. This works when the address pushed is actually the handler function and some redirection to some other handler code.
mov eax, example.0401080
push eax                 <---- add a breakpoint on the address eax contains
push dword ptr fs:[0]
mov dword ptr fs:[0], esp
Check what eax contains e.g. 0401080, go to this address and add a normal breakpoint there. You can also do this by using the Command at the bottom of the screen (case sensitive).
SetBPX 0401080
In this case this is just the indirect handler function that contains a jmp to the VCRUNTIME140.dll, this isn’t going to work. Also sometimes it may be that the breakpoint does not work properly due to other effects from further anti-debugging measures.
Breaking on accessing the SEH handler function on the stack
The idea behind it is that somewhen the CPU will have to access the address that was pushed previously to jump there, doing a memory access. In this case a hardware breakpoint is used that may not be susceptible to side effects of anti-debugging and anti-anti-debugging techniques.
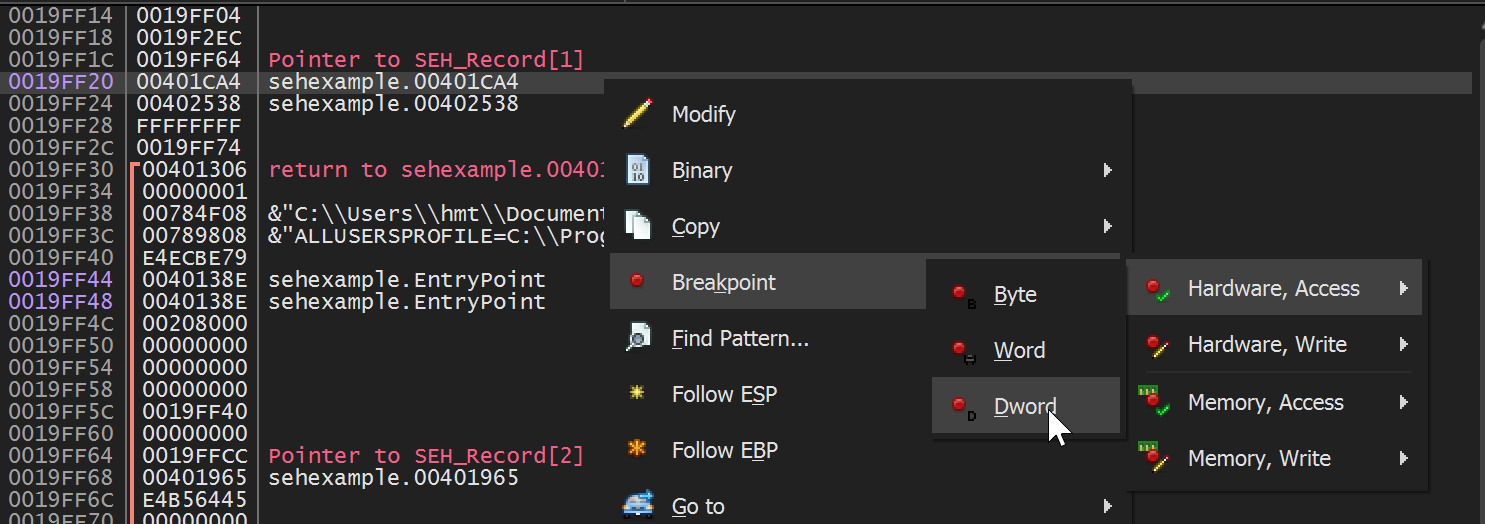
Using that method you wait that the handler function address is pushed onto the stack and add a hardware access breakpoint on this address i.e. DWORD on the stack.
Again, it will stop the execution, but when you continue you will be way too early before the CPU jumps into the actual SEH handler function. So, no luck there either.
Manually searching the SEH handler function address
Basically this method already has been mentioned before. This requires to understand that the code does uses a SEH3 _SCOPETABLE_ENTRY and where the actual user code HandlerFunc resides, namely at entry+8.
So just before the push fs:[0] (or the indirect version via eax) occurs one has to inspect if before the pushed SEH exception handler there is also a struct pushed that is a _SCOPETABLE_ENTRY. Luckily IDA automatically caught it in this case.
In the debugger you follow 1) the struct in the dump window. There you switch to the address view 2) and take the third entry which is at offset struct+8. This DWORD address is then followed 3) in the Disassembler window where you can add a breakpoint 4). Then the execution can continue and the debugger will break at the SEH exception handling code.
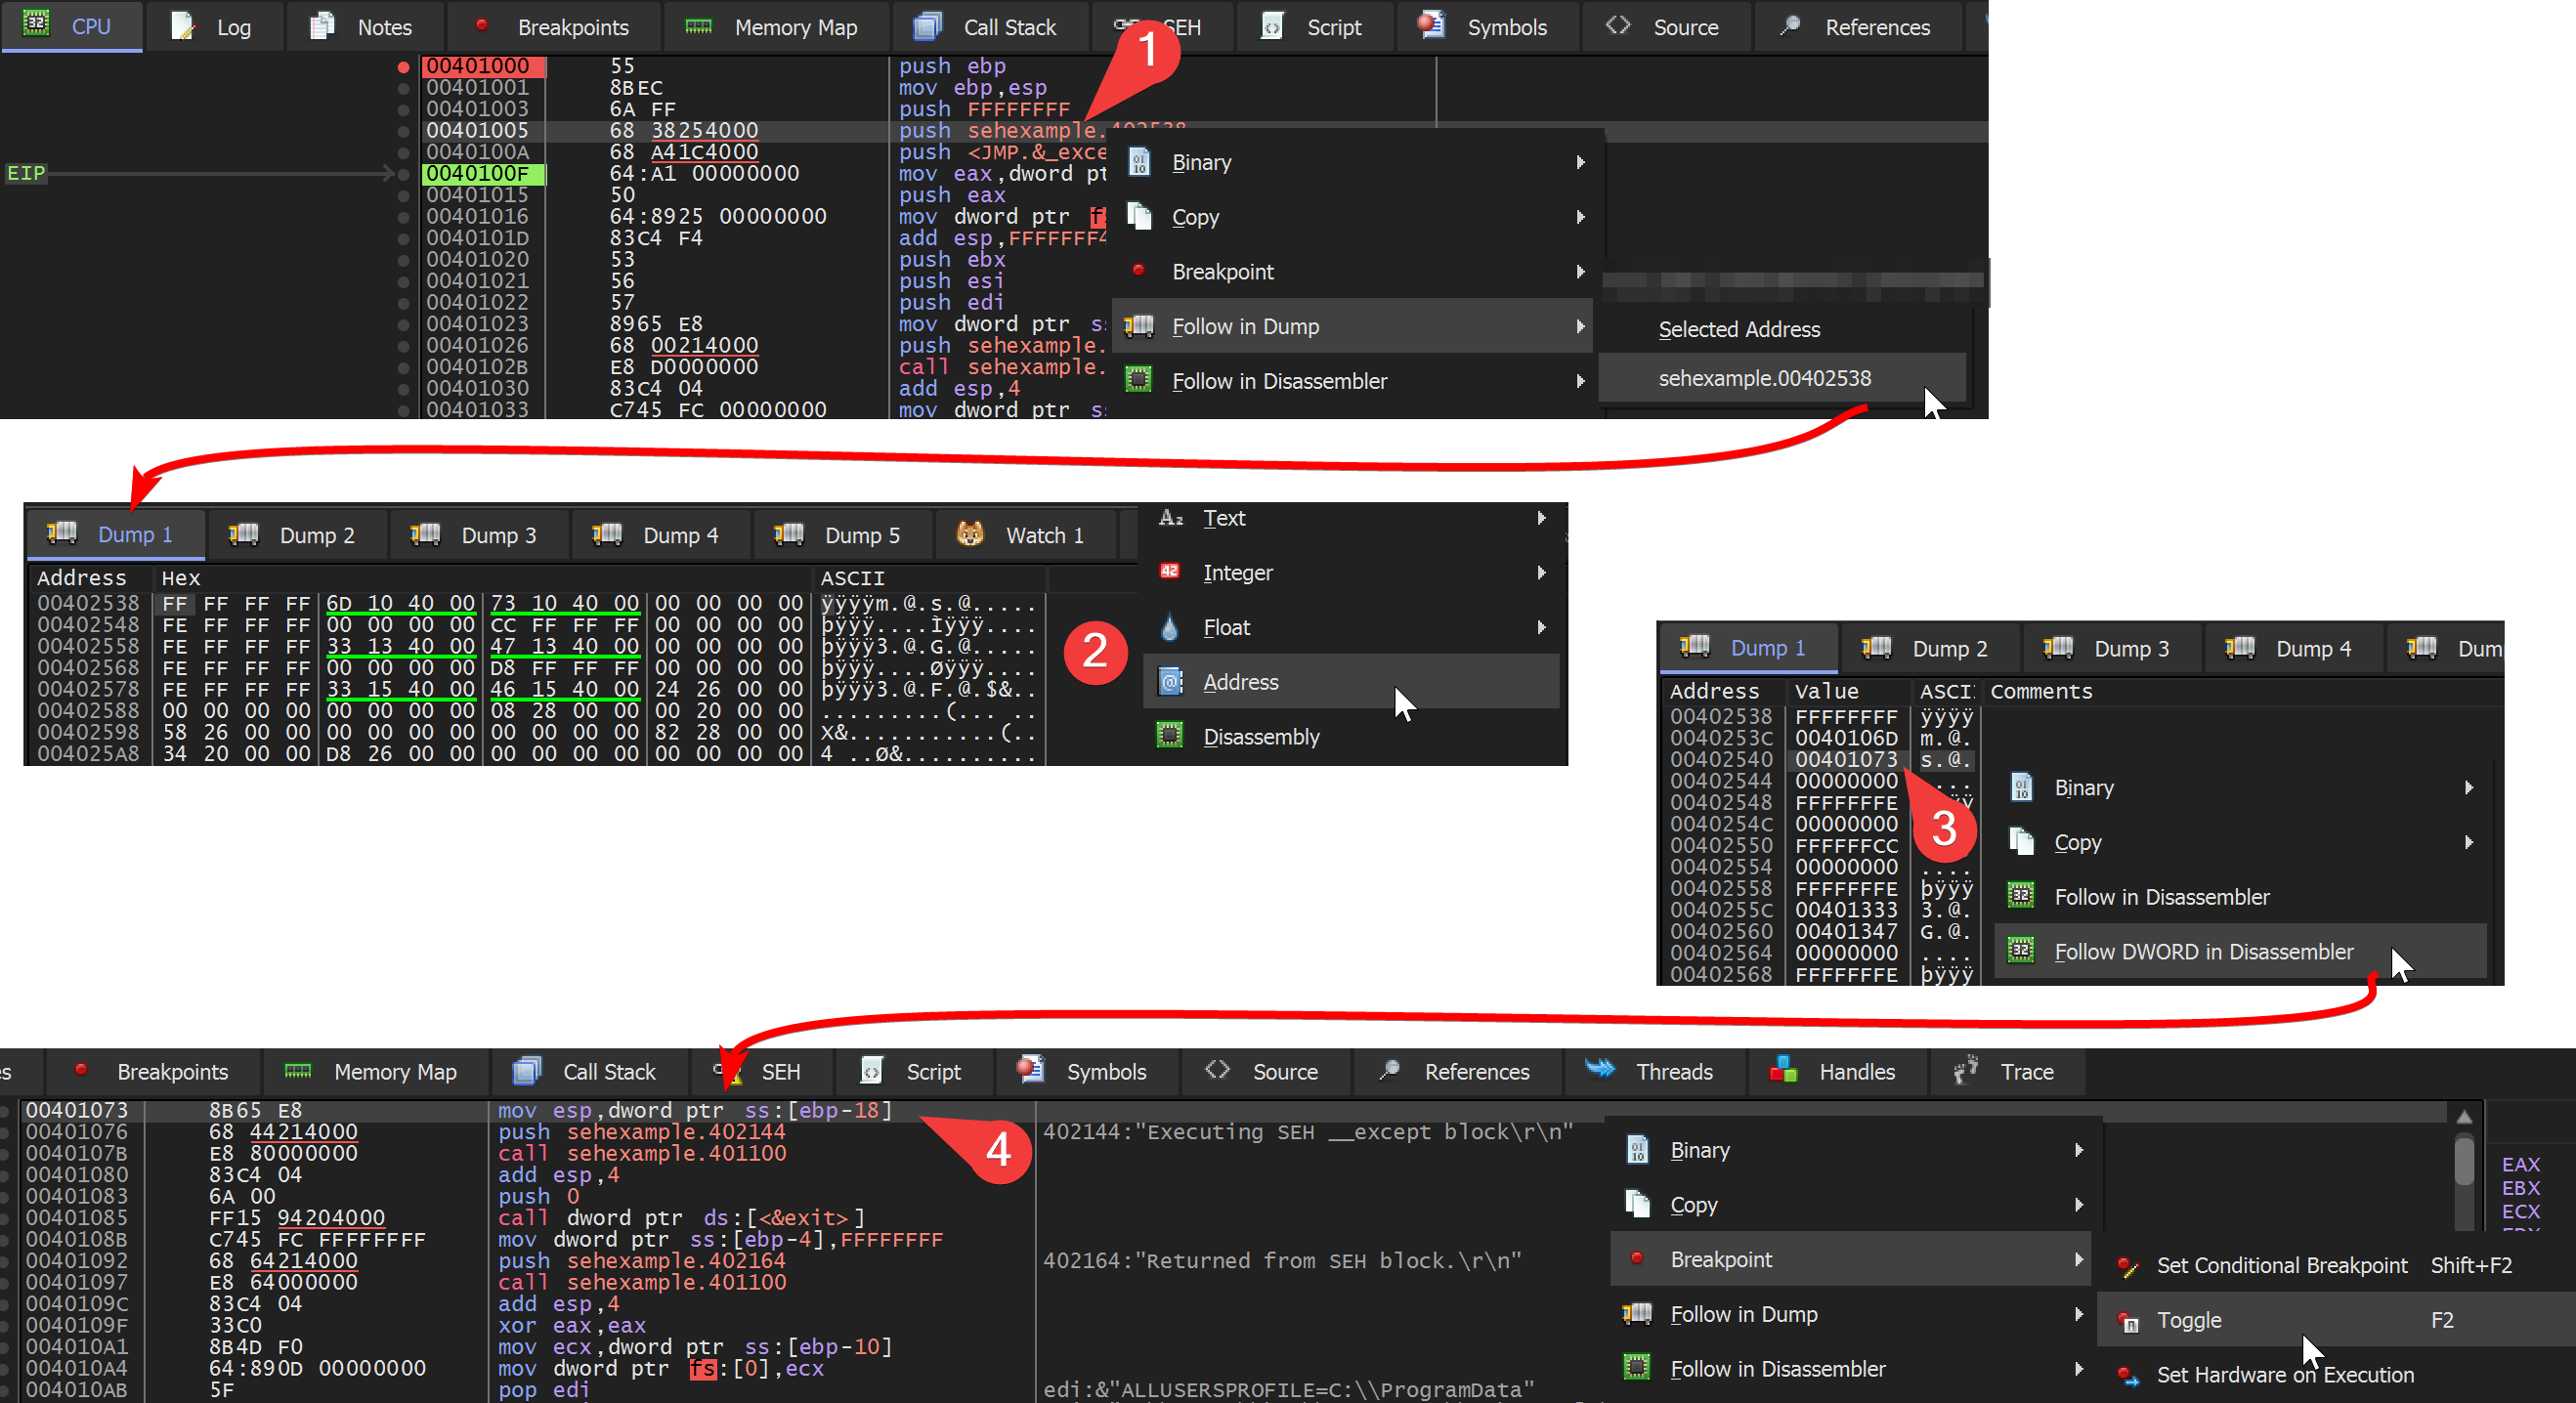
You can also add the breakpoint in the Command line without following the code in the Disassembler window.
SetBPX 00401073
Breaking on accessing the user code section
I found this technique by utkonos when searching for more straight forward methods to work with exceptions while working with malware. This might come in handy when you can’t use a breakpoint like in the method before because the int 3 is not (always) triggered successfully or the malware itself recognizes it.
This method basically adds a memory access breakpoint to the .text section of the EXE. First, when the exception occurs, the CPU interrupts and hands over the execution to the operating system i.e. ntdll.dll. Then the exception handler is called - the memory access breakpoint triggered - and it will “jmp-redirect” to the VCRUNTIME140.dll, leaving the .text section of the EXE and into the .text section of the DLL. Since memory access breakpoints are single-shots you have to re-add it. When the DLL hands over the execution back to the exception handling code in the EXE, the memory access breakpoint on the .text section is triggered again.
In short: Whenever the execution comes back to our EXE, break. Twice.
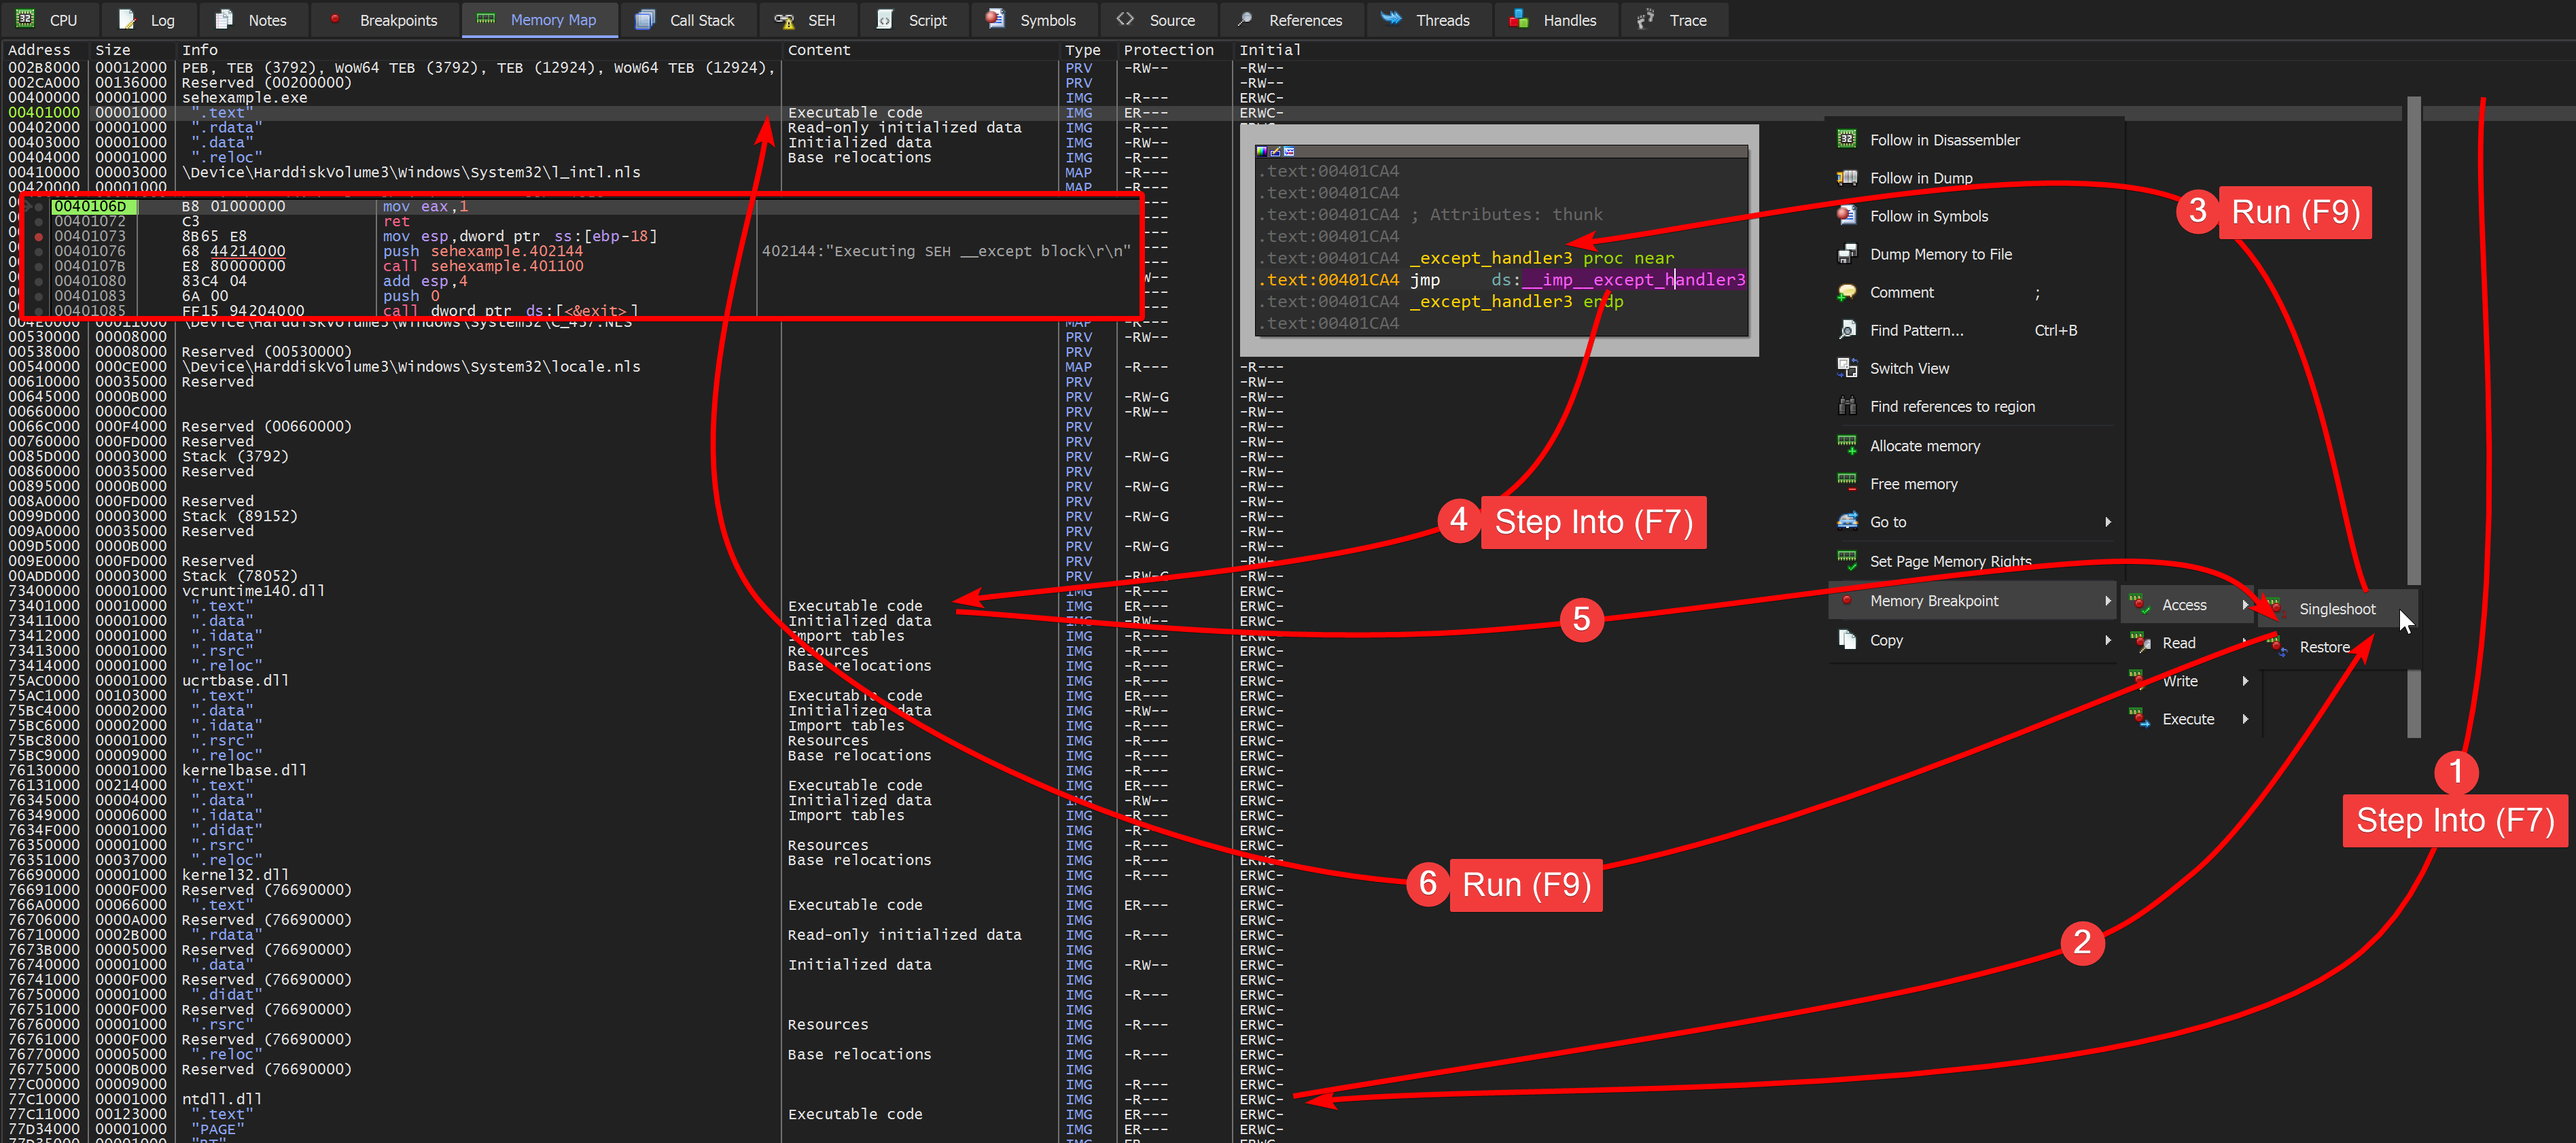
The individual steps explained:
- The exception is raised, step into the exception handler of the operating system in ntdll.dll
- Add a memory access breakpoint on the .text section of sehexample.exe
- Run. x96dbg will break on the handler_code
- Step into the VCRUNTIME140.dll
- Add again a memory access breakpoint on the .text section of sehexample.exe
- Run. x96dbg will break on the FilterFunc that was pushed via the _SCOPETABLE_ENTRY
Note that the actual HandlerFunc is after the ret, you can just step into it.
Breaking point
There are other breakpoint types that might be needed to work with malware that uses anti-debug tricks, but this would be a different topic I won’t cover here for now. This is about how SEH works with 32 bit EXEs and what ways are available to break on the exception handler code.
Of course, there may be errors and mistakes in this post, corrections and comments are welcome. And surely there are more even better ways to work with SEH than I know of.
Tooling
I used
- IDA Free
- x96dbg
- pestudio
- Visual Studio Code
- Microsoft Visual C++ (MSVC) compiler toolset